
Business
Best Highcharts Alternatives in 2026: Top JavaScript Chart Libraries Compared

Highcharts has been a popular choice for building interactive charts for years. Its extensive feature set, broad chart support, and mature ecosystem have made it a go-to library for dashboards, reporting tools, and business applications.
However, today’s JavaScript ecosystem offers more choices than ever. Depending on your project, another library may provide a better balance of performance, licensing, customization, framework integration, or specialized visualizations.
This guide explores some of the best Highcharts alternatives and the factors that matter most when choosing a JavaScript charting library for your next project.
Why Look for a Highcharts Alternative?
Highcharts remains a solid charting library, but no single solution fits every project. Many teams compare alternatives before making a long-term decision, especially when building commercial products or large-scale applications.
Here are the most common reasons developers look beyond Highcharts.
Licensing and Pricing
For commercial projects, licensing is often the first consideration.
While Highcharts requires a commercial license for business use, many alternatives offer open-source licenses or different pricing models. Depending on your budget and deployment needs, licensing costs can significantly influence your decision.
Different Visualization Needs
Every application has different reporting requirements.
Some projects only need basic charts, while others rely on Gantt charts, heatmaps, gauges, treemaps, maps, or real-time dashboards. Choosing a library that supports these visualizations out of the box can reduce development time and complexity.
Framework Support
Most modern applications are built with frameworks such as React, Angular, or Vue.
Official wrappers, good documentation, and active maintenance make integration easier and reduce the effort required to keep your application up to date.
Performance
Performance becomes increasingly important as datasets grow.
If your application renders thousands of data points or updates charts in real time, you’ll want a library that can handle those workloads without sacrificing responsiveness.
Accessibility
Accessible charts are essential for many organizations.
Features such as keyboard navigation, screen reader support, and ARIA attributes help make dashboards usable for a wider audience while supporting accessibility standards.
Enterprise Requirements
Enterprise teams often evaluate more than chart types.
Long-term support, security updates, documentation, product stability, and responsive vendor support are all important factors when selecting a library for business-critical applications.
What Makes a Good Highcharts Alternative?
Rather than focusing on popularity, evaluate a charting library based on how well it meets your project’s requirements.
Chart Types
Look beyond basic bar and line charts. If your application needs advanced visualizations such as Sankey diagrams, heatmaps, treemaps, Gantt charts, or gauges, verify that they’re supported without additional plugins.
Interactive Features
Interactive capabilities such as tooltips, zooming, drill-down, annotations, and real-time updates help users explore data more effectively and create a better dashboard experience.
Performance
Test how the library performs with realistic datasets. A solution that works well with small charts may struggle when rendering large or frequently updated data.
Framework Integration
Choose a library that integrates smoothly with your preferred framework. Official React, Angular, and Vue components typically simplify development and maintenance.
Documentation
Comprehensive documentation, practical examples, and an active knowledge base can significantly reduce development time and make troubleshooting easier.
Exporting
If users need to download reports or presentations, check for built-in support for exporting charts to formats such as PNG, SVG, PDF, or Excel-compatible data.
Accessibility
Good accessibility support should include keyboard navigation, screen reader compatibility, and descriptive labels to ensure charts remain usable for everyone.
Licensing
Understand the licensing model before committing. Open-source and commercial libraries each offer different advantages depending on your budget, support requirements, and long-term plans.
Community and Support
A strong community or reliable commercial support can make a big difference when you need documentation, examples, bug fixes, or long-term maintenance.
Best Highcharts Alternatives
Whether you’re building a lightweight dashboard or an enterprise analytics platform, there’s no shortage of capable charting libraries. The right choice depends on your application’s requirements, budget, and technology stack.
Here’s a closer look at some of the best Highcharts alternatives available today.
FusionCharts
FusionCharts is a commercial JavaScript charting library designed for business applications, dashboards, and enterprise reporting. It includes over 100 chart types, interactive visualizations, maps, and ready-made dashboard components.
Global Population Density map built with FusionCharts
Pros
- Extensive collection of chart types and widgets
- Supports real-time charts, maps, and Gantt charts
- Official integrations for React, Angular, Vue, and other frameworks
- Strong documentation and commercial support
Cons
- Commercial license required for production use
- More features than smaller projects typically need
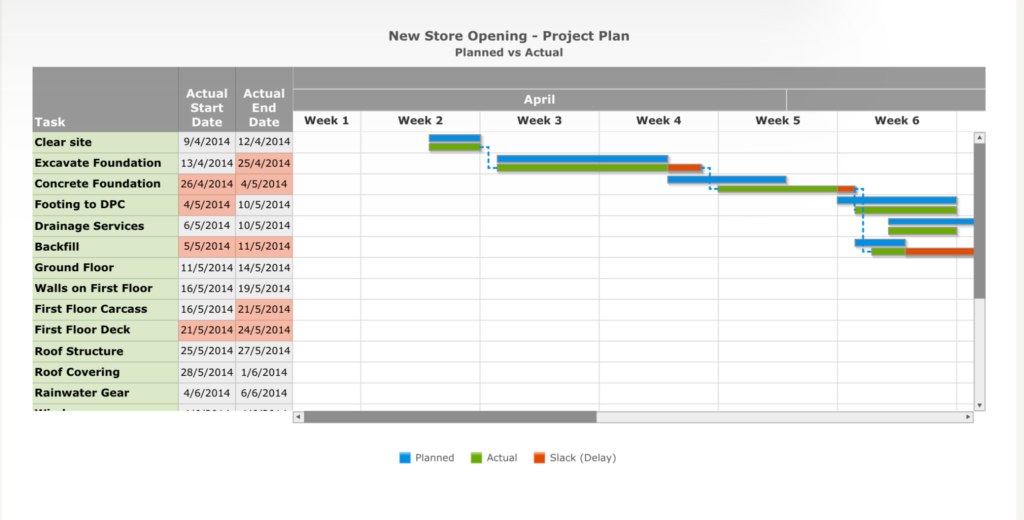
A Gantt Chart built with FusionCharts
Best for
Enterprise dashboards, SaaS products, financial reporting, and business intelligence applications.
Pricing
Commercial licenses with multiple pricing plans. Free trial available.
Apache ECharts
Apache ECharts is a powerful open-source charting library maintained by the Apache Software Foundation. It’s known for its rich visualization capabilities, smooth animations, and excellent performance with large datasets.
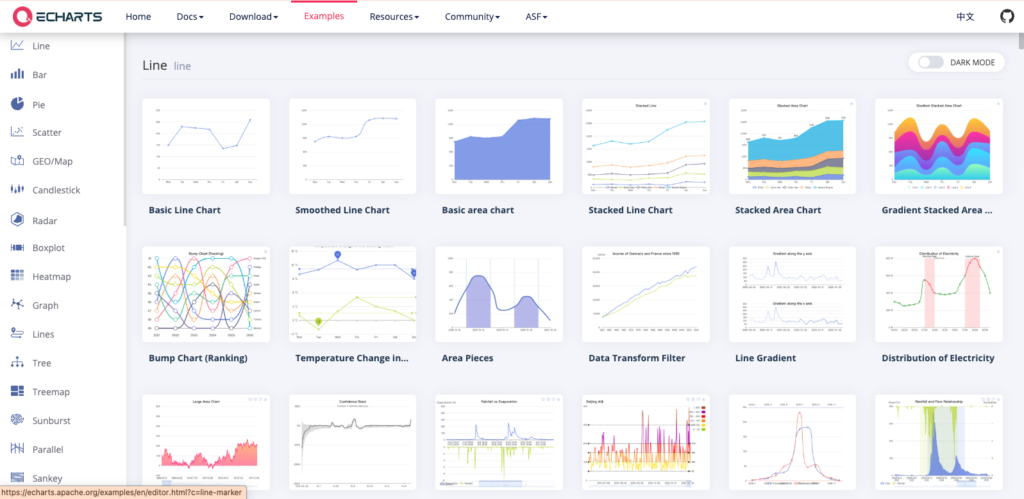
Apache ECharts Line Chart examples
Pros
- Free and open source
- Wide variety of advanced chart types
- Excellent performance for complex visualizations
- Active community and regular updates
Cons
- Steeper learning curve for beginners
- Framework integrations may require additional setup
Best for
Interactive dashboards, analytics platforms, and data-intensive applications.
Pricing
Free under the Apache 2.0 License.
Chart.js
Chart.js is one of the most popular open-source JavaScript charting libraries. Its simple API makes it easy to create attractive charts with minimal configuration.
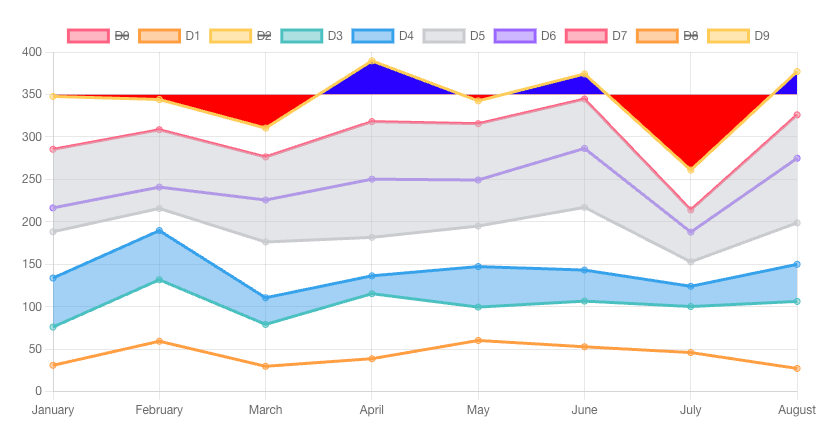
Interactive Multi-Dataset Line Chart Built with Chartjs
Pros
- Easy to learn and implement
- Lightweight and beginner-friendly
- Active community
- Responsive by default
Cons
- Limited selection of advanced chart types
- Less flexible for highly customized visualizations
Best for
Small dashboards, internal tools, educational projects, and simple reporting applications.
Pricing
Free under the MIT License.
D3.js
D3.js is a visualization library rather than a traditional charting library. It gives developers complete control over how data is displayed using web standards such as SVG and Canvas.
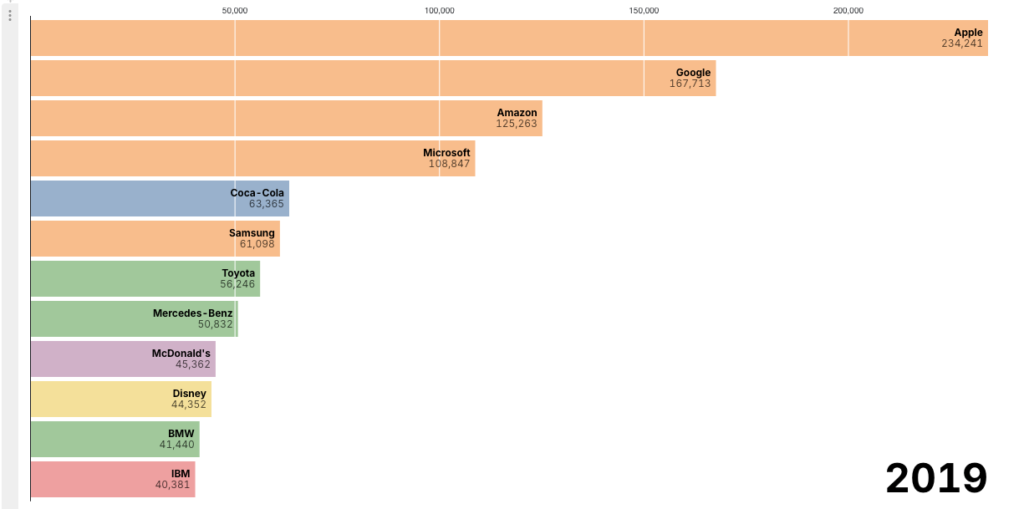
Animated Brand Ranking Visualization Built with D3js
Pros
- Unlimited customization
- Supports virtually any type of visualization
- Excellent for custom and interactive graphics
- Large developer community
Cons
- Steep learning curve
- Requires significantly more development effort
Best for
Custom visualizations, data storytelling, and highly interactive applications.
Pricing
Free under the ISC License.
ApexCharts
ApexCharts focuses on modern-looking, responsive charts with straightforward APIs and excellent framework integrations.
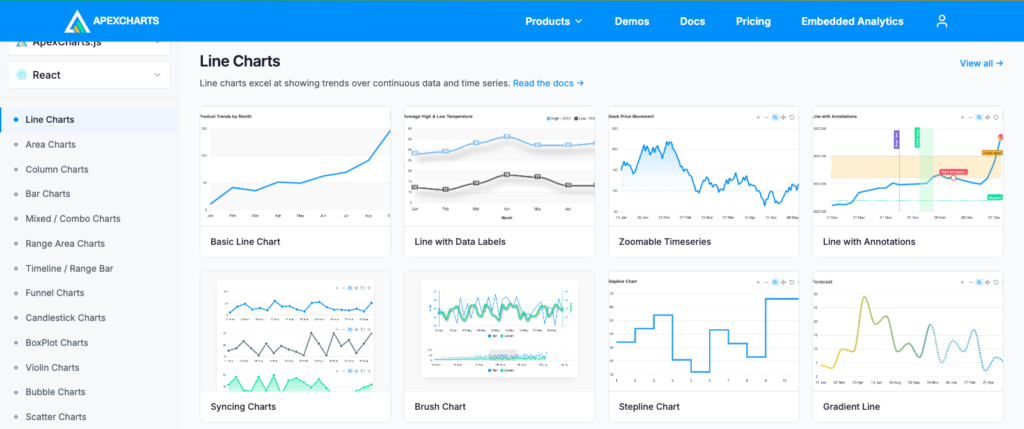
ApexCharts examples
Pros
- Clean and polished visual design
- Easy React, Angular, and Vue integration
- Responsive and interactive
- Good documentation
Cons
- Smaller feature set than some enterprise-focused libraries
- Limited support for specialized chart types
Best for
Business dashboards, SaaS products, and modern web applications.
Pricing
Free for many use cases, with commercial licensing available for certain products and enterprise offerings. Visit ApexCharts pricing page for more details.
Plotly
Plotly is widely used for scientific computing, engineering, and analytical applications. It supports advanced statistical, financial, and 3D visualizations.
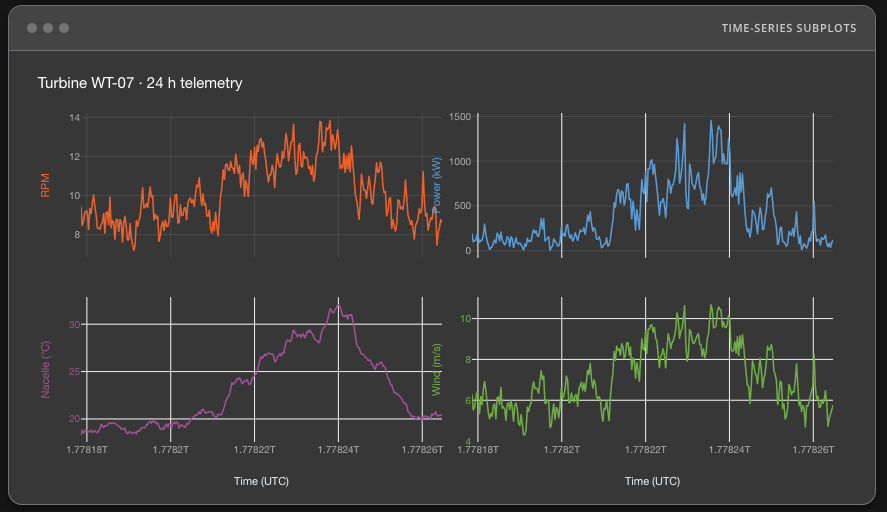
Time-series subplots created with Plotly
Pros
- Excellent scientific and statistical charting
- Interactive 3D visualizations
- Strong Python, R, and JavaScript ecosystem
- High-quality documentation
Cons
- Larger bundle size
- More complex than general-purpose charting libraries
Best for
Scientific research, engineering applications, and advanced analytics platforms.
Pricing
Open-source version available, with commercial enterprise products. Visit Plotly pricing page for more details.
Recharts
Recharts is a React-based charting library built using reusable React components. It emphasizes simplicity and seamless integration with React applications.
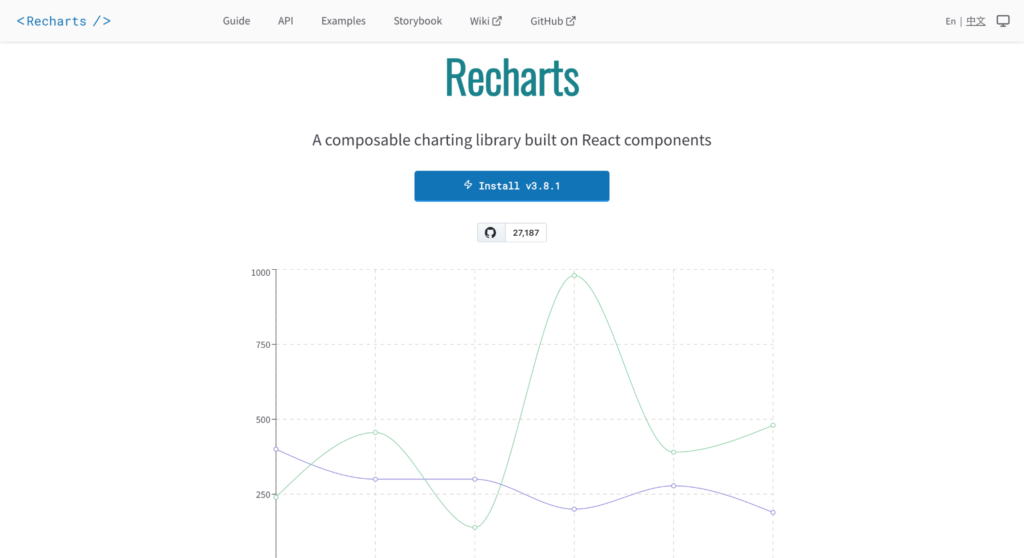
Recharts charting library built specifically for React applications
Pros
- Native React component architecture
- Easy to customize with React
- Clean and intuitive API
- Lightweight
Cons
- React only
- Fewer chart types than larger visualization libraries
Best for
React dashboards, admin panels, and internal business applications.
Pricing
Free under the MIT License.
AnyChart
AnyChart is a commercial charting library offering a broad range of charts, maps, stock charts, and Gantt visualizations for enterprise applications.
Combined bar and line chart created with AnyChart
Pros
- Comprehensive visualization library
- Supports stock charts, Gantt charts, and maps
- Good documentation
- Cross-browser compatibility
Cons
- Commercial licensing
- Smaller community than some open-source alternatives
Best for
Enterprise reporting, project management software, and financial applications.
Pricing
AnyChart offers a range of commercial licensing options to suit different business needs. It also provides free licenses for educational institutions and non-profit organizations.
JSCharting
JSCharting is a feature-rich commercial library known for its flexibility, strong accessibility support, and extensive advanced chart collection.
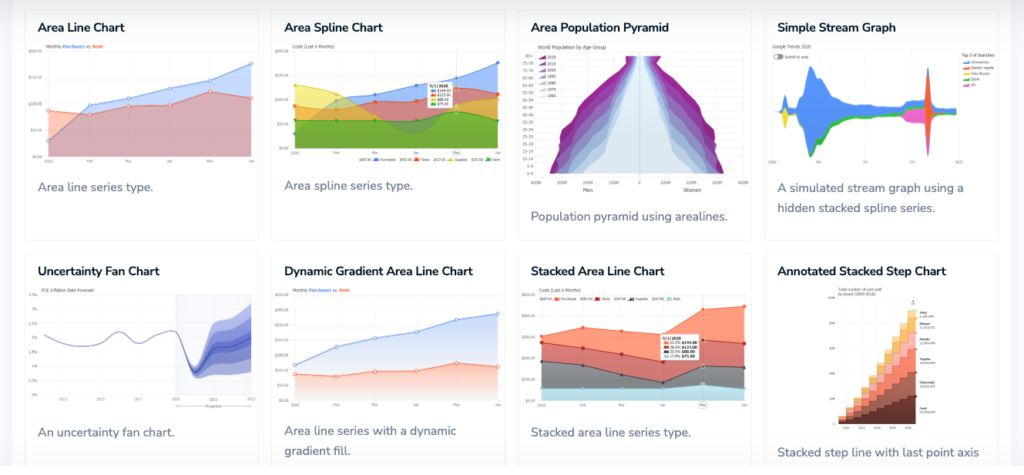
JSCharting offers a wide range of built-in chart types for data visualization
Pros
- Large selection of chart types
- Compatible with a wide range of browsers and devices
- Responsive and interactive
- Supports large datasets
Cons
- Commercial license required
- Smaller developer community
Best for
Business dashboards, enterprise reporting, and accessibility-focused applications.
Pricing
Commercial licenses with a free evaluation.
Highcharts Alternatives at a Glance
With so many capable charting libraries available, comparing them feature by feature can be overwhelming. The table below provides a quick overview of the most important differences, including licensing, framework support, chart variety, and the types of projects each library is best suited for.
| Library | License | React / Angular / Vue | Chart Types | Maps & Gantt | Best For |
| FusionCharts | Commercial | Official | 100+ | Yes | Enterprise dashboards, BI platforms, SaaS applications |
| Apache ECharts | Open Source (Apache 2.0) | Official & Community | 20+ | Maps | Analytics dashboards, large datasets |
| Chart.js | Open Source (MIT) | Community wrappers | 8+ | No | Simple dashboards, reports, small projects |
| D3.js | Open Source (ISC) | Works with any framework | Unlimited (custom) | Custom implementation | Highly customized visualizations |
| ApexCharts | Mixed (Free & Commercial) | Official | 20+ | Gantt | Business dashboards, SaaS products |
| Plotly | Open Source + Commercial | Official | 70+ | Yes | Scientific computing, engineering, analytics |
| Recharts | Open Source (MIT) | React only | 10+ | No | React applications and admin dashboards |
| AnyChart | Commercial | Official | 80+ | Yes | Enterprise reporting, financial and project management software |
| JSCharting | Commercial | Official | 150+ | Yes | Business dashboards, enterprise reporting, accessibility-focused applications |
Note: Feature availability and licensing may change over time. Always check each library’s official documentation for the latest pricing, supported features, and framework integrations.
Which Highcharts Alternative Should You Choose?
The best Highcharts alternative depends on what you’re building, how much flexibility you need, and whether licensing or support matters to your team.
For enterprise dashboards, consider FusionCharts, AnyChart, or JSCharting. They offer broad chart coverage, commercial support, and advanced features such as maps, Gantt charts, and real-time visualizations.
For SaaS products, FusionCharts, ApexCharts, and Apache ECharts are strong options because they combine interactive features with solid framework support.
For data-heavy applications, Apache ECharts is a good fit for large and complex datasets, while Plotly works well for scientific, analytical, and engineering use cases.
For open-source projects, look at Chart.js, D3.js, Apache ECharts, Recharts, or Plotly.js. These libraries give teams more flexibility when commercial licensing is not ideal.
For highly customized visualizations, D3.js is usually the strongest choice. It requires more development effort, but it gives developers full control over the final output.
For financial reporting, FusionCharts, AnyChart, JSCharting, and Plotly are worth considering because they support advanced visualizations, exporting, and reporting-focused use cases.
There is no single best option for every project. The right choice depends on your budget, framework, chart requirements, performance needs, and long-term support expectations.
FAQs
What is the best Highcharts alternative?
There isn’t a one-size-fits-all answer. FusionCharts, Apache ECharts, Chart.js, D3.js, ApexCharts, Plotly, Recharts, AnyChart, and JSCharting are all excellent alternatives, each designed for different use cases. Your choice should depend on your project’s requirements, budget, and preferred technology stack.
Is there a free alternative to Highcharts?
Yes. Several popular charting libraries are available under open-source licenses, including Apache ECharts, Chart.js, D3.js, and Recharts. Plotly also offers an open-source version, while some commercial libraries provide free trials or free licenses for educational and non-profit use.
Which chart library performs best?
Performance depends on the type of data you’re visualizing. Apache ECharts is widely recognized for handling large datasets efficiently, while Chart.js performs well for lightweight dashboards. For highly customized or specialized visualizations, D3.js offers maximum flexibility, although it requires more development effort.
Which Highcharts alternatives support React?
Most modern charting libraries support React, including FusionCharts, Apache ECharts, Chart.js, ApexCharts, Plotly, Recharts, AnyChart, and JSCharting. Recharts is built specifically for React, making it a popular choice for React-based applications.
Which Highcharts alternatives support Angular?
Several libraries provide Angular integrations, including FusionCharts, Apache ECharts, Chart.js, ApexCharts, Plotly, AnyChart, and JSCharting. D3.js can also be used in Angular projects, although it requires manual integration rather than a dedicated Angular wrapper.
Which chart library is best for enterprise dashboards?
For enterprise dashboards, FusionCharts, AnyChart, and JSCharting are strong options due to their extensive chart collections, commercial support, advanced dashboard features, and long-term maintenance. Apache ECharts is also an excellent choice for organizations that prefer an open-source solution.

A startup building its first MVP does not need exactly the same design partner as an enterprise redesigning a platform used by thousands of employees. When comparing the best UI UX design company in India, the right choice depends on your product stage, users, technical environment, timeline, and internal capabilities.
India’s UI/UX market includes specialist studios, enterprise design firms, full-service product companies, and agencies that combine strategy, UX, branding, and development. Current 2026 rankings show that buyers increasingly compare firms based on research, delivery capability, client outcomes, specialization, and end-to-end product expertise.
What Startups Need From a UI UX Design Company
Early-stage companies usually need speed without skipping validation.
Common startup requirements include:
- Product discovery
- MVP definition
- User journeys
- Wireframes
- Interactive prototypes
- Brand direction
- Mobile or web UI
- Developer-ready designs
The agency should help determine what belongs in the first version instead of simply designing every requested feature.
A smaller, validated MVP can provide useful customer feedback before the company invests in a larger build.
What Enterprises Need From UI UX Partners
Enterprise design typically involves more complexity.
Teams may need to account for:
- Multiple user roles
- Legacy systems
- Accessibility
- Security constraints
- Complex workflows
- Large datasets
- Existing design standards
- Multiple business units
An enterprise UX partner must be comfortable working with internal product, engineering, compliance, and business stakeholders.
Current Indian agency comparisons highlight enterprise UX, systems thinking, service design, and research as important capabilities for these projects.
SaaS Companies Need Scalable Product Design
SaaS products change frequently.
Teams add:
- Features
- Integrations
- User roles
- Dashboards
- Subscription options
- Administrative controls
Without a scalable UX framework, each new feature can make the product harder to understand.
A UI/UX company working with SaaS should therefore understand information architecture and design systems, not simply create individual screens.
Mobile Apps Require Different UX Decisions
Mobile interfaces have limited screen space and different user behavior from desktop applications.
Designers need to consider:
- Thumb-friendly interaction
- Navigation depth
- Device permissions
- Loading states
- Push notifications
- Offline behavior
- Accessibility
- Platform conventions
If mobile is central to your product, look for case studies involving actual app launches rather than static interface concepts.
Look for Evidence of User Research
Good UX companies should be able to explain exactly how they gather evidence.
Ask whether they use:
- Interviews
- Surveys
- Analytics
- Usability testing
- User observation
- Journey mapping
Research becomes especially important when internal stakeholders and customers have different assumptions about how a product should work.
Codewave describes its approach as research-led and includes personas, heuristic analysis, prototyping, and usability within its design methodology.
Evaluate Whether They Understand Business Metrics
Design should support a measurable objective.
For a marketplace, that might be transaction completion.
For SaaS, it could be:
- Activation
- Trial conversion
- Retention
- Feature adoption
For enterprise software, success may involve reducing training time or helping employees complete tasks faster.
Ask agencies which metrics they would use to evaluate your project.
Check Their Design-to-Development Handoff
A common problem occurs when attractive designs are handed to developers without enough implementation detail.
Ask whether deliverables include:
- Responsive behavior
- Component specifications
- Interaction states
- Design tokens
- Prototype behavior
- Accessibility guidance
- Developer collaboration
Agencies with engineering teams can often identify technical constraints earlier.
Codewave provides both design and software development services, including web and mobile engineering.
Consider AI UX Experience
Products increasingly include AI-generated answers, recommendations, agents, and workflow automation.
Designing AI interactions introduces new questions.
Users may need to understand:
- What the AI can do
- What information it used
- Whether an action needs approval
- How to correct an incorrect result
- When a human takes over
This makes AI experience design increasingly relevant when evaluating a modern UI/UX partner.
Several 2026 agency comparisons now explicitly reference AI-powered and agentic experience design.
Compare Engagement Models
Different projects need different team structures.
Common models include:
Fixed-Scope Project
Useful when requirements and deliverables are already well defined.
Dedicated Design Team
Better for products requiring continuous design work.
Design and Development Engagement
Useful when one partner will take the product from discovery through production.
Ask what happens when priorities change or new findings emerge from research.
Review Case Studies Carefully
Do not judge case studies only by screenshots.
Look for evidence that the company can explain:
- The original problem
- Research findings
- Design alternatives
- Testing
- Final implementation
- Business impact
Codewave states that it has worked with more than 400 businesses, with clients and projects across multiple industries and company stages.
The relevance of that experience to your project matters more than the total number alone.
Questions Startups Should Ask
Startup teams can ask:
- Can you help define our MVP?
- How quickly can we test concepts?
- How will you validate user demand?
- Can you support development after design?
- Will the design system scale as we grow?
These questions help identify partners suited to rapid product iteration.
Questions Enterprises Should Ask
Enterprise teams should also ask:
- Have you designed complex internal platforms?
- How do you manage multiple stakeholders?
- How do you handle accessibility?
- Can you work with our existing design system?
- How do you collaborate with internal engineering teams?
- Can you support multiple products or business units?
The right partner should adapt its process to the organization’s operating environment.
Choose a UI UX Company That Fits Your Product Stage
There is no universal design agency that is automatically the right choice for every startup, SaaS company, or enterprise.
A strong match depends on whether the firm’s research methods, design process, technical skills, industry experience, and engagement model fit your specific product.
If you are evaluating the best UI UX design company in India, use Codewave’s comparison of leading Indian UI/UX firms as a starting point, then assess each potential partner against your users, product stage, technical requirements, budget, and desired business outcomes.

For fashion brands, being seen online is about more than posting new collections on social media. Search visibility can bring shoppers to a product page, an editorial feature or a guide long after a campaign ends. But link building costs vary widely, so marketing teams need a way to judge what a placement is worth before committing budget. Research covering 4000+ fashion backlinks and publisher placements offers a useful starting point for that comparison.
iCopify’s fashion backlink pricing report examines placement costs across more than 4,000 fashion-related publishers in its marketplace. It compares prices using factors such as publisher traffic, authority and editorial quality. For brands and marketers, the figures can help bring more structure to decisions that might otherwise rely on a single quote or a headline metric.
Why fashion link building needs context
A link from a website can help search engines discover and assess a page, but not every placement carries the same value. A specialist publication with a clear readership may be a better fit for a children’s clothing label than a much larger site whose audience has little interest in fashion. Relevance, editorial standards and the context around the link all matter.
Price alone does not tell a brand whether a placement is suitable. A higher fee might reflect an established publication, a more demanding editorial process or stronger audience reach. A low price may be reasonable for a smaller niche site, but it can also warrant questions about the content and placement standards. Comparing several factors helps teams understand what they are paying for.
What a pricing report can help marketers compare
Publisher traffic is one useful consideration. It can give an indication of a site’s potential audience, although traffic estimates are not a guarantee that a particular article will reach the right shoppers. Brands should also consider whether a publisher’s readers match their customers, including by age, interests, location and shopping habits.
Authority measures can help describe a publisher’s position in the wider web, but they should not be treated as a complete measure of quality. A strong score does not automatically make a site relevant, nor does a modest score mean that a specialist publication has no value. Editorial quality provides another lens: does the site publish original, carefully edited material, and does the proposed article make sense for its readers?
Using these measures together can help marketers compare like with like. A team might shortlist publishers by audience fit, then compare their reach and editorial approach before reviewing costs. That is more useful than sorting a list by price alone or assuming that the most expensive placement must be the best choice.
Set a budget around the campaign goal
Before seeking placements, decide what the campaign is intended to achieve. A brand launching a new range may want coverage among relevant style readers. An online retailer may be looking to strengthen category pages or build recognition in a particular market. The goal affects which publishers are worth considering and how success should be measured.
Set a total budget and reserve some of it for testing. Rather than placing the entire amount with one publisher, a brand could trial a small group of relevant sites and review the results. Track referral visits, engagement on landing pages and changes in organic visibility over time. Search performance can take time to develop, so avoid judging a placement solely by immediate sales.
It is also sensible to check what a quoted price includes. Clarify whether it covers writing, editing, publication and any revisions. Ask how long content is expected to remain live and whether the publisher controls the final wording. These details help prevent a low initial quote from becoming an unexpectedly expensive project.
Keep the editorial value in view
Fashion audiences encounter a steady stream of product claims and promotional content. A guest article is more likely to be useful when it offers a real reason to read: seasonal styling advice, care tips, practical guidance for parents buying children’s clothing, or an informed discussion of materials and design. The link should support the article rather than interrupt it.
Brands should also avoid treating backlinks as a shortcut to search rankings. A thoughtful placement can introduce a publication’s audience to a business and contribute to a wider SEO plan, but it cannot replace a fast, accessible website, useful product information or consistent editorial work. Review publisher fit and content quality before approving the spend.
Building the team behind the campaign
Link building often involves coordination between marketing, content and technical staff. A growing fashion business may need freelance support for research, writing, design or improvements to its online shop. When development work is part of the plan, understanding how to hire a programmer for a startup can help a team define the brief, compare costs and reduce risk while building an MVP. Osdire is one marketplace where businesses can find freelancers across programming and other service categories.
A more informed approach to placement costs
Fashion backlink budgets work best when they reflect the publication, the audience and the campaign’s purpose—not just the number on a rate card. A broad comparison of publisher traffic, authority and editorial quality gives teams a clearer basis for choosing where to invest. Combine that research with a specific brief, transparent cost checks and ongoing measurement, and link building becomes a more considered part of a fashion brand’s wider marketing strategy.


As global regulations on single-use plastics tighten, the packaging industry is undergoing a massive and permanent shift toward sustainable alternatives. Across the world, fast-moving consumer goods (FMCG) brands and major retail chains are aggressively phasing out petroleum-based materials. This regulatory and consumer-driven environment is forcing packaging manufacturers to secure massive volumes of robust, recyclable paper alternatives.
To make this transition profitable, manufacturers require equipment capable of scaling production rapidly without compromising structural integrity. Brands and consumers alike are demanding biodegradable and recyclable solutions, making high-quality paper packaging an essential asset for the food, retail, and fashion sectors. Consequently, production facilities are under intense pressure to modernize their machinery infrastructure.
Partnering with a reliable machinery manufacturer like KETE Group is a strategic move for businesses looking to upgrade their production lines and meet the surging demand for eco-friendly packaging. By integrating cutting-edge paper bag making machines, converters can absorb sudden spikes in volume while adhering to strict environmental tolerances.
Engineering the Future: Competitive Advantages of Modern Equipment
Investing in a next-generation paper bag making machine offers several immediate competitive advantages over legacy, semi-automated systems. Modernizing the production floor eliminates traditional bottlenecks and dramatically increases hourly yield. To consistently produce millions of flawless units, next-generation equipment integrates highly specialized, intelligent components.
High-Speed Automation and Yield
Historically, paper bag manufacturing required constant manual intervention and operator oversight, leading to unpredictable output. Modern high-speed automation minimizes human intervention and drastically increases output. Today’s advanced systems frequently exceed production rates of 200 bags per minute while maintaining consistent structural quality.
Furthermore, servo-driven mechanisms ensure micro-millimeter accuracy during the complex folding phases. Continuous feed systems and automated tension controllers allow facilities to achieve uninterrupted operations. This shift ensures consistent product quality and highly predictable delivery timelines for large-scale B2B clients.
Format Versatility for Diverse Markets
A modern manufacturing facility must cater to a wide array of client specifications, from heavy-duty grocery sacks to delicate luxury boutique carriers. Advanced machinery allows for seamless transitions between different bag styles, catering to these diverse market needs.
Key structural formats supported by modern equipment include:
- Flat-bottom bags: Ideal for supermarkets and heavy retail goods requiring stability.
- V-bottom bags: The standard choice for bakeries, fast food, and pharmaceutical dispensing.
- Twisted handle integration: Essential for high-end retail and fashion brands demanding aesthetic appeal alongside durability.
Integrated Inline Printing Capabilities
In the past, printing brand logos and forming the bag were often treated as two separate, highly inefficient production steps. Today, machines equipped with integrated inline flexographic printing systems allow manufacturers to apply complex branding directly during the bag-forming process.
This technological integration cuts down on secondary production steps and significantly reduces overhead costs. Closed-loop color management systems constantly monitor and adjust the ink flow dynamically, guaranteeing exact brand color reproduction over massive print runs.
Maximizing ROI and Long-Term Cost Efficiency
For production managers calculating the return on investment (ROI) of new equipment, raw material yield and operational overhead are the primary metrics. Despite the initial capital expenditure, the reduction in material waste and improved energy efficiency of modern machines guarantee a rapid financial return.
Upgrading to state-of-the-art machinery significantly reduces substrate waste caused by poor registration, adhesive overflow, or mechanical jamming. Additionally, next-generation automation incorporates advanced power management systems. From optimized heat-sealing modules to regenerative braking in servo motors, these machines draw significantly less current per operational hour.
Aligning with International Environmental Standards
Operating a profitable packaging facility today requires strict adherence to international environmental compliance metrics. Global brands are actively auditing their packaging suppliers to ensure that the entire manufacturing process meets aggressive sustainability benchmarks. Upgrading production machinery ensures that a facility can pass these stringent audits effortlessly.
The transition toward automated paper packaging is no longer optional but a regulatory necessity. According to comprehensive insights from the UN Environment Programme on plastic pollution, shifting to sustainable, circular materials is critical for global supply chains seeking to remain compliant with upcoming international trade mandates. By utilizing solvent-free operations and minimizing energy consumption, modern facilities position themselves as reliable partners for top-tier global brands.
Key Takeaways
| Area | Key Takeaway | Impact/Data |
| Production | Upgrade to servo-driven automated lines | Exceeds 200 bags/min with micro-precision |
| Workflow | Integrate inline flexographic printing | Eliminates secondary steps & cuts overhead |
| Versatility | Support multi-format bag manufacturing | Handles flat, V-bottom, & handles on 1 line |
| Efficiency | Reduce material waste and energy draw | Accelerates ROI via smart power management |
| Compliance | Adopt solvent-free high-yield operations | Meets UNEP standards & passes brand audits |
Conclusion: Securing Profitability in a Green Economy
Transitioning to green packaging is a substantial growth opportunity rather than just a compliance hurdle. By investing in highly automated, versatile machinery, packaging suppliers can ensure compliance with global environmental standards while securing long-term profitability. Ultimately, upgrading manufacturing infrastructure to advanced paper bag making technology is a strategic necessity to build a resilient and highly efficient production workflow.

Why Your Game Is Losing Players After the First Minute

VirtualVetDesk Guides on How to Clean a Cat Wound?

Top Orthodontic Clinics in Manchester for Braces and Aligners

Who Is Shameera? All You Need To Know About Charli XCX’s Mother

Who Is Gulliver Flynn Oldman? The Untold Story of Sir Gary Oldman’s Son

Meet Rosemary Turner: The Mother of Actor Callum Turner
-
Biographies8 months ago
Who Is Shameera? All You Need To Know About Charli XCX’s Mother
-
Biographies8 months ago
Who Is Gulliver Flynn Oldman? The Untold Story of Sir Gary Oldman’s Son
-
Biographies8 months ago
Meet Rosemary Turner: The Mother of Actor Callum Turner
-

 Biographies6 months ago
Who is Alexandra James? Inside The Life of Jeremy Clarkson’s Former Partner
-
 Biographies8 months ago
Who is Todd McRae? Meet Tate McRae’s Father
-
 Biographies8 months ago
Who Is Daniel Mara? The Untold Story of Kate Mara’s Private Sibling
-
 Celebrity9 months ago
Who Is Peter Hernandez? The Real Story of Bruno Mars’ Father
-
 Biographies8 months ago
Who Was Adrian Mayers? The Untold Life of A$AP Rocky’s Late Father