
Business
What Are All-Terrain Tires Good For?

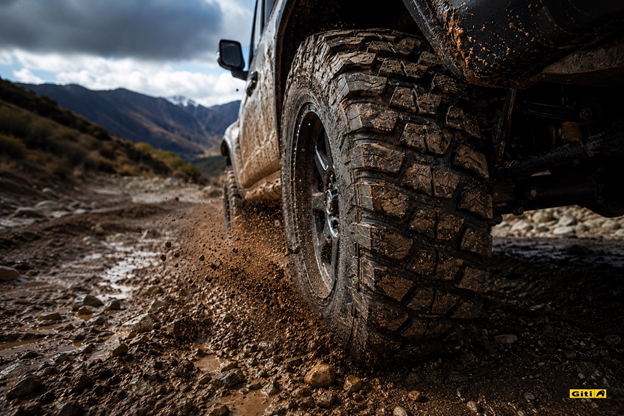
7 Real-World Use Cases
All terrain tires are built to handle more than just the morning commute, but they’re not right for every driver. Knowing exactly where they perform, and where they don’t, is what separates a smart upgrade from an expensive mistake. Here are seven real-world situations where an AT tire earns every kilometer.
1. Weekend Trail Driving and Light Off-Roading
This is the core use case all-terrain tires were designed for. Gravel trails, rocky fire roads, river crossings, compacted dirt, an AT tire handles all of it without requiring you to buy a dedicated mud-terrain tire that turns your daily drive into a noise nightmare.
The aggressive shoulder blocks and open tread voids that define an AT tire bite into loose surfaces and self-clean as you go. That means grip when the surface shifts under you, not just when it’s predictable.
Sidewall integrity is what separates a capable trail tire from one that fails. Reinforced sidewalls and upper sidewall protection are worth prioritizing here, trail debris doesn’t care about your tire’s marketing claims, and a sidewall puncture in a remote location is a far more serious problem than a tread puncture.
2. Daily Commuting on Mixed Road Surfaces
Most AT tire buyers are not hardcore off-roaders. They drive to work on sealed roads five days a week, then take the truck out on a gravel road or rural property on weekends. That’s exactly the split an AT off road tires is designed to manage.
The key is balance. A well-engineered AT tire prioritizes on-road comfort and quietness without sacrificing the off-road capability that makes it worth buying. You don’t want a tire that punishes your weekday commute just to handle a weekend trail.
For this use case, tread noise is the spec to watch. More aggressive tread patterns generate more road noise at highway speeds. If your commute involves significant motorway time, look for AT tires that specifically engineer for noise reduction alongside off-road grip.
3. Unpaved Rural and Farm Roads
Loose gravel, dusty red clay, seasonal mud patches, compacted dirt driveways, these surfaces destroy all-season tires over time. They are exactly what AT tires are engineered to shrug off.
Farmers, rural property owners, and anyone whose access road changes character with the weather need a tire that doesn’t require swapping out seasonally. An AT tire’s wider tread voids clear debris continuously, while its reinforced construction resists the slow punctures that gravel roads serve up.
This is a long-term cost argument as much as a performance one. All-terrain tires on a rural route typically outlast all-season tires on the same surface because they were built for what the road is actually doing to them.
4. Rainy Season and Wet Condition Driving
AT tires handle wet roads better than most drivers expect. The deep tread grooves and open tread design that give them grip on dirt work the same way on wet asphalt, they channel water out from under the contact patch aggressively, reducing aquaplaning risk.
This is especially relevant in tropical and subtropical climates where monsoon season turns roads unpredictable. An AT tire’s tread voids don’t fill up with water the way a fine-tread touring tire can. Grip stays more consistent across changing surface conditions.
The trade-off is worth being clear about: AT tires are not UHP wet-weather tires. Peak wet cornering at high speed belongs to performance rubber. But for everyday wet-road driving, particularly on surfaces that transition between sealed and unsealed, the AT tire’s drainage capacity is a genuine advantage.
5. Towing and Hauling with Trucks and SUVs
Towing shifts the load demands on your tires dramatically. You need stability under load, resistance to heat build-up during long highway runs, and traction when pulling away from a stop with a trailer attached. LT-rated AT tires are built for exactly this duty cycle.
The reinforced sidewalls that help on trails also help when towing. They resist side-load deformation during cornering when a loaded trailer is pushing back against the vehicle. Higher ply ratings in LT-metric AT tires increase load capacity and thermal stability compared to P-metric all-season options.
One check before buying: confirm your AT tire’s load index matches your vehicle’s GVWR when fully loaded. Not all AT tires are rated for heavy towing, verify the specs against your actual haul weight.
6. Overlanding and Long-Distance Adventure Travel
Overlanding demands more from a tire than any single use case. You need on-road efficiency across thousands of kilometers, off-road capability when the trail demands it, resistance to punctures in remote areas, and the durability to handle all of it without failure.
The self-sufficiency requirement of overlanding is what makes construction quality matter most. Thick sidewalls reduce the likelihood of an unrepairable sidewall tear in a remote location. High natural rubber content in the tread compound increases cut and chip resistance on sharp rock surfaces. These are failure-prevention specs, evaluate them seriously before choosing an overland tire.
Tread depth is also worth checking. Deeper tread provides longer service life on variable surfaces, which matters when you’re covering serious distance between service stops.
7. Mild Winter and Seasonal Driving Conditions
AT tires are not snow tires. That distinction matters and this article won’t paper over it. If you’re in a region with regular deep snow and sustained sub-zero temperatures, dedicated winter tires are the correct answer.
That said, all-terrain tires handle light to moderate winter conditions, fresh powder, slushy roads, frozen gravel better than all-season touring tires. The open tread voids that work in mud and loose dirt also provide bite in shallow snow.
Look for the Three-Peak Mountain Snowflake (3PMS) certification if winter performance is a priority. It confirms the tire has passed standardized testing for severe snow conditions and is not just a marketing claim. For drivers in climates with occasional winter weather rather than sustained winter, a 3PMS-rated AT tire can eliminate the seasonal swap while still providing meaningful traction over a standard all-season.
Which Giti AT Tire Fits Your Use Case?
Frequently Asked Questions
Are all-terrain tires good for highway driving?
Yes, with a caveat. Modern AT tires engineered for a 70/30 on-road/off-road balance treat highway performance as a design priority, not an afterthought. Expect slightly more road noise than a dedicated touring tire, but stable, comfortable motorway driving overall. The more aggressive the tread pattern, the more noise you carry onto the highway. Match the tread aggressiveness to your actual off-road demands.
Can I use all-terrain tires in the rain?
All-terrain tires perform well in the rain for everyday driving speeds. Their open tread voids channel water away from the contact patch effectively, reducing aquaplaning risk compared to fine-tread touring tires. They are not optimised for peak wet-cornering at high speed, that is the domain of performance all-weather or summer tires, but for mixed-surface and variable-weather driving, AT tires deliver solid, consistent wet traction.
How long do all-terrain tires last?
Under typical mixed-use conditions, well-maintained AT tires can cover 40,000 to 60,000 miles (approximately 64,000 to 96,000 km). Aggressive off-road use will reduce tread life. Regular rotation every 8,000 to 10,000 km and maintaining correct inflation pressure are the two most effective ways to extend service life. Under-inflation is the single biggest accelerator of premature AT tire wear.
What is the difference between the Giti4x4 AT70 and AT100?
The Giti4x4 AT100 is built for drivers who split their time roughly 70% on-road and 30% off-road balancing daily comfort with capable off-road performance. The Giti4x4 AT70 is for drivers with stronger off-road demands: it features a military-inspired tank-tread crown block design, 5mm reinforced sidewalls, and a chain curbing block system for upper sidewall protection. Choose the AT100 if your off-road use is occasional. Choose the AT70 if it’s serious.
Are all-terrain tires worth it for city driving only?
No. If you genuinely never leave sealed roads, an all-terrain tire is not the right tool. You will pay more, experience more road noise, and carry tread designed for surfaces you never use. For pure city driving, a quality all-season or all-weather tire is the better fit. AT tires earn their value when your driving regularly includes unpaved, loose, or variable-surface conditions.
Do all-terrain tires work in snow?
For mild snow and slush, yes. For sustained deep snow or ice, no, dedicated winter tires remain the safe choice for severe winter conditions. The open tread design of AT tires provides better snow traction than standard all-season touring tires. The Three-Peak Mountain Snowflake (3PMS) certification is the objective benchmark to look for, it confirms the tire has passed standardized severe-snow testing, not just a manufacturer claim.
The Bottom Line
All-terrain tires earn their place when your driving genuinely spans multiple surface types: mixed commuter and weekend off-road use, rural and farm roads, towing, overlanding, and variable-weather conditions. They are not the right answer for pure city commuters, serious mud, or sustained winter driving.
If your off-road use is occasional and on-road comfort matters, the Giti4x4 AT100 is the balanced call. If you push further into technical terrain and need the tire to hold up there, the Giti4x4 AT70 is built for it.
Explore the full Giti4x4 AT range at giti.com and find the tire that matches your actual driving — not the driving you think you do.
Business
From Sketch to Sign-Off: A Step-by-Step UX Prototyping Framework Used by Leading US Design Agencies


Design projects stall for a surprisingly consistent reason: teams build too much before they confirm they’re building the right thing. A developer spends two weeks on a feature. A stakeholder reviews it and asks for a fundamental change. The cycle repeats. By the time the product reaches users, it carries the weight of decisions that were never properly tested, only assumed.
This pattern is common across product teams in the United States, particularly in organizations that treat design as a visual exercise rather than a structured decision-making process. The gap between what a team imagines and what a user actually needs doesn’t close itself. It closes through structured iteration, and that iteration depends entirely on how well a team moves from early concepts to tested, approved designs.
The framework that professional design agencies use to manage this process is not a single tool or a software subscription. It is a disciplined sequence of stages, each with a specific purpose and a defined output. Understanding that sequence — and the reasoning behind it — is what separates teams that ship confident products from those that ship expensive compromises.
What UX Prototyping Actually Involves and Why It Matters Operationally
The discipline of ux prototyping sits between the moment an idea is documented and the moment engineering begins. It is the process of producing functional representations of a product — representations that are detailed enough to test and evaluate, but not so complete that changing them becomes costly. The goal is to surface problems while they are still cheap to fix.
For teams that want a grounded understanding of how this discipline is structured in professional practice, the detailed breakdown of ux prototyping as applied across real client engagements illustrates how the work is layered, not linear. Prototyping is not a single deliverable. It is a series of outputs, each answering a different question at a different level of certainty.
What makes this operationally significant is the relationship between prototype fidelity and decision quality. Early-stage prototypes answer structural questions: Does this flow make sense? Are the right tasks accessible at the right moments? Later-stage prototypes answer experiential questions: Does the interface feel predictable? Can a first-time user complete this task without guidance? Confusing these stages — or skipping between them — produces decisions based on incomplete evidence.
The Difference Between a Wireframe and a Prototype
These terms are often used interchangeably, but they represent distinct stages of design development. A wireframe is a static representation of layout and structure. It communicates hierarchy and placement, but it does not simulate behavior. A prototype, by contrast, is interactive. It allows a person to move through a designed experience, respond to interface elements, and reveal whether the logic of the design matches the expectations of the user.
Treating wireframes as sufficient for validation is a common operational risk. A static screen can look clear and intentional while hiding significant usability problems that only appear when a user tries to actually accomplish something. The interaction — the tap, the scroll, the search, the form submission — is where assumptions meet reality. Prototyping is the controlled environment in which that meeting happens before production.
Starting with Discovery: How Constraints Define the Prototype
Before any design work begins, effective agencies invest time in understanding the constraints that will shape the prototype. These constraints come from three directions: the business, the user, and the technology. A prototype built without accounting for all three is essentially a design fiction — it may look functional but it cannot be validated against real conditions.
Business constraints define what success looks like and what tradeoffs are acceptable. User constraints define what the person interacting with the product already knows, expects, and struggles with. Technology constraints define what is feasible within the existing infrastructure. Discovery work surfaces these constraints before they become expensive surprises during development.
Conducting Research That Informs Structure, Not Just Aesthetics
User research conducted before prototyping tends to focus on behavior patterns, not preferences. Preference-based research tells you what people say they want. Behavior-based research tells you what people actually do when they encounter a problem. The latter is significantly more useful when designing the flow and logic of a product.
Agencies that produce reliable prototypes typically structure their discovery research around task analysis — understanding what a user is trying to accomplish, in what context, and with what prior experience. This produces a set of design requirements grounded in real conditions rather than assumptions. According to principles outlined by the Nielsen Norman Group, task analysis is one of the most reliable methods for identifying the gaps between expected workflows and actual user behavior, making it a foundational input for any prototype brief.
Low-Fidelity Prototyping: Testing Concepts Before Committing to Form
Low-fidelity prototypes are the first interactive artifacts in the design process. They are intentionally rough — hand-drawn sketches, paper mockups, or simple digital screens with minimal visual treatment. Their purpose is not to communicate the final design. Their purpose is to test whether the underlying concept holds up under scrutiny.
This stage is where structural decisions are made. Navigation models, content hierarchy, primary user paths, and key decision points are all evaluated at low fidelity. Because these prototypes are inexpensive to produce and modify, they support rapid iteration without the psychological resistance that comes when a polished design is criticized.
Managing Stakeholder Expectations at This Stage
One of the consistent challenges agencies face during low-fidelity testing is stakeholder discomfort. Decision-makers who are accustomed to seeing finished presentations can struggle to evaluate a rough sketch with the same analytical clarity they bring to a polished document. This discomfort, if not managed, can push teams to skip low-fidelity stages entirely and move directly to high-fidelity designs — which reintroduces exactly the kind of costly late-stage change that prototyping is meant to prevent.
Experienced design leads address this by framing low-fidelity reviews explicitly as structural reviews, not aesthetic reviews. The question on the table is not “does this look good?” but “does this logic work?” Separating those questions into distinct review stages maintains the integrity of the process.
Mid-Fidelity Prototyping: Where Logic Meets Behavior
Mid-fidelity prototypes represent a significant step forward in specificity. At this stage, the design has a defined visual language — spacing, type hierarchy, component behavior — and the interactions are scripted in enough detail to support meaningful user testing. The prototype can simulate a real experience without requiring production code.
This is typically the most analytically productive stage of the prototyping process. The product is detailed enough to generate genuine user responses, but flexible enough to accommodate changes without the technical cost of rebuilding coded components. Most of the serious usability findings that shape a final product emerge here.
Structuring Usability Testing at Mid-Fidelity
Usability testing at this stage is most effective when it is task-based and moderated. Participants are given a specific objective — find a product, complete a checkout, locate a support resource — and asked to attempt it without guidance. The moderator observes where the user hesitates, where they misread an interface element, and where they succeed or abandon the task.
The insights from this testing do not just inform visual adjustments. They surface logical problems in the information architecture, gaps in feedback design, and moments where the system’s behavior contradicts the user’s expectation. Each of these findings has a corresponding cost in user trust and task completion rate if left unresolved before launch.
High-Fidelity Prototyping: Preparing for Sign-Off and Handoff
High-fidelity prototypes are near-production representations of the final design. They include full visual treatment, accurate content, realistic interaction states, and often an animation or transition behavior that reflects the intended development output. At this stage, the prototype is not being evaluated for structure or logic — those questions should already be resolved. It is being reviewed for accuracy, completeness, and production readiness.
This stage serves two distinct audiences: the stakeholders who will approve the design for development, and the engineers who will build from it. A high-fidelity prototype that lacks component specifications, edge case handling, or documented interaction states forces developers to make design decisions independently — which is a common source of discrepancy between what was approved and what ships.
What a Developer Handoff Should Actually Contain
Effective handoff documentation goes beyond the prototype screens. It includes annotated interaction notes explaining non-obvious behaviors, a documented component library with defined states, and a clear specification of how the design should adapt across screen sizes and input methods. Without this documentation, the prototype becomes a reference image rather than a functional specification, and the gap between design intent and technical output widens accordingly.
Agencies that produce consistent results at handoff maintain a review step specifically for this documentation — separate from the visual design review — to confirm that what the developer receives is complete enough to build from without repeated clarification cycles.
Governance and Version Control Across the Prototype Lifecycle
Prototype files accumulate quickly. Without a clear version control practice, teams end up reviewing outdated screens, implementing changes that were already reversed, and losing track of which decisions were validated against which test findings. This is less a design problem than an operational one, and it affects teams of all sizes.
Professional agencies typically maintain a single source of truth for prototype files — a master file that is updated sequentially, with archived versions clearly labeled by date and review stage. Annotation within the file documents why changes were made, not just what changed. This creates a traceable record of design decisions that supports both stakeholder communication and future product iterations.
Conclusion: Why the Framework Matters More Than the Tools
The tools used to build prototypes — whether browser-based design software, native applications, or coded frameworks — matter far less than the discipline applied at each stage of the process. A well-structured prototype workflow produces more reliable outcomes not because of what it builds, but because of what it prevents: assumptions that survive too long, decisions made without evidence, and changes discovered after they become expensive.
For product teams evaluating their own design process, the most useful question is not which tools to adopt but which stages are currently being skipped or compressed. Most process failures in design can be traced to structural shortcuts — moving from concept to high fidelity without testing, or from testing to handoff without proper documentation. The framework used by leading agencies is not proprietary. It is disciplined, and that discipline is available to any team willing to treat each stage as necessary rather than optional.
A product that reaches users well-tested and clearly specified does not happen by chance. It happens because the decisions that shaped it were evaluated at the right fidelity, at the right time, by the right people — and because the process that enabled those evaluations was respected from sketch to sign-off.


Changing a flat tire is much easier when you have the right lifting equipment in the trunk. An electric car lift jack can raise a vehicle with motor-driven power instead of requiring the user to turn a traditional jack handle by hand. For drivers who regularly travel long distances, tow vehicles, or simply want a quicker way to handle roadside tire changes, this can be a useful addition to an emergency kit. The key is choosing a jack with enough capacity, a suitable lifting range, stable contact with the vehicle, and dependable power.
An electric scissor jack is one of the common designs used for this purpose, although electric hydraulic models are also available. The right choice depends on the vehicle’s weight, ground clearance, lifting points, and the type of work you plan to perform. A jack should never be selected only because its maximum capacity looks impressive. It also needs to match the vehicle manufacturer’s lifting instructions and provide a stable setup on a suitable surface.
What Makes an Electric Car Jack Different?
A powered jack uses an electric motor to perform the lifting movement, reducing the physical effort needed from the driver. Many portable models connect to a vehicle’s 12-volt electrical system, while some designs use rechargeable batteries. Depending on the model, the control panel may include up and down controls, an LED work light, a pressure display, or other emergency features.
The biggest advantage is convenience during roadside repairs. Instead of manually operating a mechanical jack for every turn, the user can control the lifting mechanism with buttons or a remote. Some kits combine the jack with an impact wrench and tire inflator, creating a compact roadside repair setup rather than a jack alone.
How an Electric Scissor Jack Lifts a Vehicle
The scissor mechanism uses crossing metal arms that extend as a threaded screw moves through the assembly. When the motor turns the screw, the arms spread and raise the saddle toward the vehicle’s approved lifting point. This design is relatively compact, which makes an electric scissor jack practical for storage in a trunk or emergency equipment compartment.
The lifting range matters just as much as the rated capacity. A jack may support a heavy vehicle but still be unsuitable if its minimum height is too high for the vehicle or its maximum height is too low to lift the tire clear of the ground. Always compare the jack’s lifting range with the vehicle’s actual ground clearance and the manufacturer’s recommended lifting points..
Understanding Jack Capacity Before Buying
Capacity tells you the maximum load the jack is designed to support, but it should not be treated as a reason to lift any vehicle below that limit without checking other specifications. For example, a jack rated at 5 tons or 11,000 pounds is designed around that stated maximum capacity, but the vehicle’s weight distribution and the amount of load reaching the individual lifting point still matter. A vehicle also should not be lifted at an arbitrary location simply because the jack can physically fit underneath it.
Many portable electric car jacks are marketed for sedans, SUVs, pickups, and similar vehicles. Some current models specify capacities around 5 tons and lifting ranges extending from roughly 6 inches to more than 17 inches, depending on the configuration. These specifications can make a jack versatile, but the manufacturer’s instructions for the specific vehicle remain the final reference.
Why Lifting Range Deserves More Attention
Drivers often focus on lifting capacity and overlook minimum and maximum height. That can cause problems when a vehicle sits very close to the ground or requires substantial clearance before the tire can be removed. A low-profile vehicle may need a jack with a lower starting height, while an SUV or pickup may require more extension.
Some electric jacks use an adjustable or extended lifting section to accommodate different vehicle heights. Before purchasing, measure the approximate distance between the ground and the approved lifting point, particularly if the vehicle has modified suspension, oversized tires, or unusually low clearance. Matching these measurements to the jack’s published range helps prevent an otherwise capable jack from becoming impractical.
Power Options and Roadside Reliability
A portable electric jack is only useful if it has a dependable source of power when you need it. Many 12-volt models can draw power through a vehicle’s accessory socket or connect directly to the battery with clamps. Battery-powered versions eliminate the need for a cable running to the vehicle, but the battery must remain charged and stored correctly.
Power demand is another consideration. A motor lifting a heavy load can draw substantial current, so users should follow the manufacturer’s requirements for electrical connections and avoid relying on damaged cables, loose connections, or unsuitable extension arrangements. Some models also include manual lowering or other backup mechanisms, which can be valuable if electrical power is interrupted.
Safety Starts Before the Motor Runs
An electric motor doesn’t make vehicle lifting risk-free. Park on a firm, level surface whenever possible, engage the parking brake, and follow the vehicle manufacturer’s instructions for the approved lifting points. Wheel chocks can provide additional protection against unwanted movement, especially when lifting one side or one corner.
The saddle should sit squarely against the intended lifting point, and the jack should remain stable throughout the lift. Never exceed the rated capacity, and do not improvise a lifting location because the recommended point is inconvenient. Vehicle manufacturers can specify very particular areas for lifting, and some modern vehicles have components underneath that should not carry jack loads.
Jack Stands Are Not Optional for Under-Car Work
A vehicle jack is primarily a lifting device, not a substitute for a permanent support system. If you need to work underneath a vehicle, use properly rated jack stands positioned at the manufacturer’s approved support points. NHTSA vehicle guidance specifically warns against getting underneath a vehicle supported by a jack alone.
This distinction matters because a jack can lose stability or fail, and even a small movement can create a serious hazard. Jack stand quality matters too; recalls have occurred involving stands that could suddenly collapse under load. For a simple roadside tire change, keep the task limited to what the vehicle and jack instructions allow, and never place any part of your body beneath an unsupported vehicle.
Useful Features for Emergency Tire Changes
Not every electric jack has the same feature set. A basic model may focus only on powered lifting, while a larger kit can combine several roadside tools. The useful features depend on how you expect to use the equipment.
Look for features such as:
- A clearly marked up and down control
- A stable, wide base
- A non-slip saddle
- A suitable lifting range
- Overload protection where provided
- An LED work light for nighttime repairs
- A manual lowering or emergency-release function
- A 12-volt power connection or rechargeable battery
- A built-in tire inflator on combination kits
- A carrying case for organized storage
Some combination kits include an inflator and electric impact wrench alongside the jack. One current 5-ton kit, for example, lists a 12-volt jack, built-in compressor, and impact wrench with a stated maximum torque of 420 N·m. These extras can reduce the number of separate tools required during a roadside tire change, but they also add components that should be inspected and maintained.
Electric Jack or Manual Jack?
A manual jack is usually simpler because it does not depend on a motor, battery, or electrical connection. It can also be useful as a backup when electrical equipment has a problem. Its drawback is that lifting requires more physical effort, particularly when the vehicle needs to be raised several inches.
An electric model is more convenient when speed and reduced physical effort are priorities. However, it introduces additional considerations such as electrical power, motor operation, battery condition, and electronic controls. For frequent travelers, carrying an electric jack alongside a suitable backup plan can offer convenience without relying on a single piece of equipment for every situation.
Getting the Most From a Portable Electric Jack
Before putting the jack in your vehicle, test its controls and inspect the power cable, plug, saddle, base, and lifting mechanism. Store the equipment where it will remain dry and protected from unnecessary impacts. If the model uses a rechargeable battery, check the manufacturer’s storage and charging recommendations instead of leaving it unused for long periods.
It is also smart to practice positioning the jack at home. A roadside emergency is a poor time to discover that the cable cannot reach the power source or that the jack does not fit comfortably under the vehicle. Knowing the correct lifting point and understanding how the controls work can make an actual tire change much calmer and safer.
Common Mistakes That Can Make Lifting Unsafe
One of the most serious mistakes is placing the jack on soft, uneven, or unstable ground. Another is lifting from a location that looks strong but is not approved by the vehicle manufacturer. Using a jack beyond its rated capacity or continuing to operate it when the vehicle is unstable can also create unnecessary risk.
Drivers sometimes focus so much on getting the tire off the ground that they forget to monitor the jack during lifting. Watch the contact point and the base as the vehicle rises, and stop immediately if the saddle shifts, the vehicle moves unexpectedly, or the jack begins leaning. A portable jack should make a tire change easier, not encourage shortcuts.
Choosing the Right Electric Car Lift Jack
Start with the vehicle rather than the jack. Check the vehicle’s curb weight or relevant loaded weight, approved lifting points, minimum clearance, and the amount of height required to remove the tire. Then compare those requirements against the jack’s capacity, lifting range, power requirements, base dimensions, and safety features.
For drivers who want an emergency tire-changing tool, a compact electric model with an appropriate capacity and lifting range may be enough. Someone who regularly works on heavier vehicles may prefer a higher-capacity design with a larger operating range and additional tools. The best jack is ultimately the one whose specifications match the vehicle and whose operating instructions you can follow safely.
FAQs About Electric Car Lift Jacks
How much weight can an electric car jack lift?
The capacity depends on the specific model. Portable electric jacks are available in different ratings, including models designed around 5 tons or 11,000 pounds. Always compare the published capacity with your vehicle’s requirements rather than assuming every electric jack can lift every car.
Is an electric scissor jack safe to use?
It can be safe when used within its rated capacity and according to the vehicle and jack manufacturer’s instructions. The vehicle should be on suitable ground, the jack should contact the approved lifting point correctly, and the load should remain stable. A jack alone should not be treated as support for a person working underneath a vehicle.
Can an electric car jack change a flat tire?
Yes, an appropriately sized electric jack can be used to raise the vehicle enough to remove a wheel when used according to the manufacturer’s instructions. Some kits also include an impact wrench, which can make removing and reinstalling lug nuts easier. The tire should only be removed after the vehicle is securely positioned and stable.
Does an electric jack need a car battery?
Not always. Some models connect to a vehicle’s 12-volt system, while others use rechargeable batteries. Certain designs offer more than one power option, giving the user additional flexibility during roadside emergencies.
Can I work underneath a vehicle lifted by an electric jack?
No. A powered jack is not a substitute for properly rated support stands when work underneath the vehicle is required. Manufacturer and government safety guidance emphasizes using appropriate support and avoiding going underneath a vehicle that is supported only by a jack.
What should I check before buying an electric car jack?
Check the rated capacity, minimum and maximum lifting height, power source, saddle design, base stability, vehicle compatibility, operating controls, and any backup lowering system. Also check whether the jack reaches the manufacturer’s approved lifting point without interference from bodywork or underbody components. These details are more useful than choosing a jack based on capacity alone.

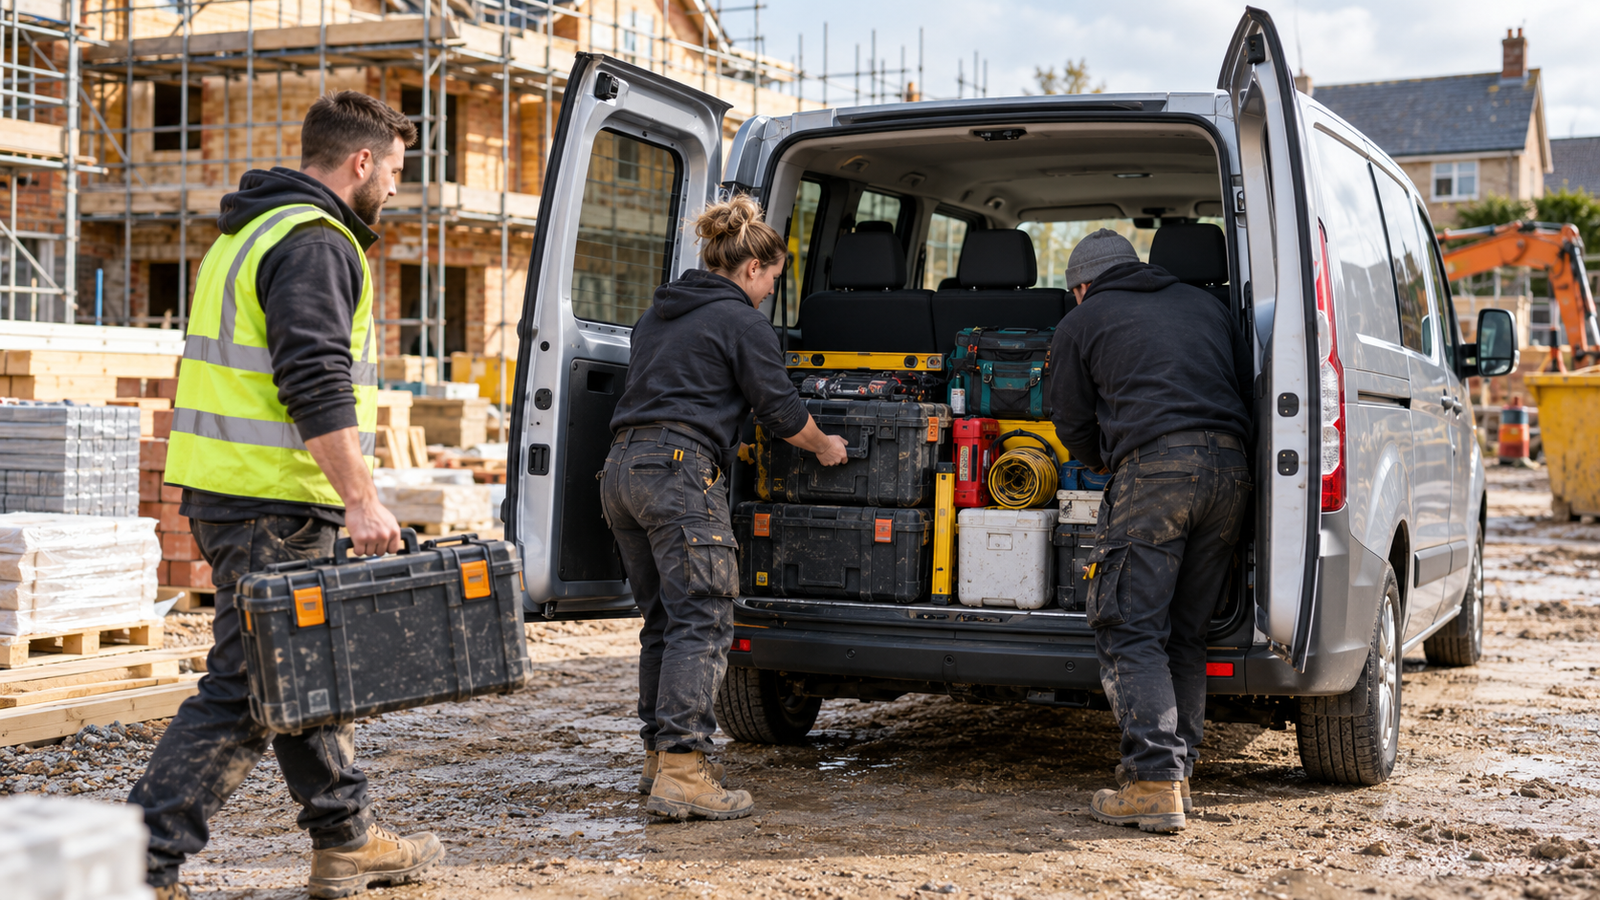
A business moving furniture, stock, or bulky equipment usually doesn’t run into trouble because it chose the wrong badge. It runs into trouble because the loading process takes too long, the floor is too high, the body is not quite large enough, or the vehicle cannot safely handle the work it is being asked to do.
That is why Luton vans remain such a practical choice for removals companies, delivery operators, event suppliers and businesses handling large commercial goods. Their box-shaped load area makes better use of space than a standard panel van, particularly when the job involves awkward furniture, stacked cartons or tall items that cannot be packed efficiently into a tapered interior.
But not every Luton suits every route. The choice between a standard Luton, low loader, tail-lift model, or curtainsider can affect speed, staff safety, and profitability on every job.
The body shape changes how a business loads.
A conventional panel van is excellent for tools, smaller stock and day-to-day trade work. A Luton van is designed around volume.
The large box body creates a more square, upright loading space, making it easier to arrange household furniture, retail deliveries, exhibition equipment, and boxed stock for a removals business, which can mean fewer wasted gaps between items. For a delivery company, it can mean a more organised route because stock can be grouped by drop or customer.
The advantage is not simply more cubic space. It is usable space.
A business carrying sofas, wardrobes, appliance boxes or commercial displays often needs a load area that can be packed methodically. A Luton body gives crews room to use blankets, straps, trolleys and protective materials without turning every collection into a puzzle.
Start with the hardest item, not the average load.
The best way to choose a Luton van is to work backwards from the item that causes the most difficulty.
For some companies, that’s a three-seat sofa. For others, it may be a stack of roll cages, a large piece of machinery, a palletised delivery or a set of exhibition stands. Measure the item, note its weight and consider how it is loaded at both ends of the journey.
Then consider the usual location. A Luton van delivering to a warehouse with a loading bay has different requirements from one completing residential removals on narrow streets. Roof height, wheelbase, turning space and rear access all become more important when the business regularly visits homes, city centres or older commercial premises.
Choose the vehicle around the difficult jobs, because those are the jobs that expose a poor specification.
Standard Luton, low loader or tail lift?
A Luton van isn’t a fixed format. The loading arrangement can vary significantly, and that is where a business can make its smartest decision.
| Type of vehicle | Best suited to | Main advantage | Key consideration |
| Standard Luton | General removals and deliveries | Large, square load body | Higher load floor may require more lifting |
| Low loader Luton | Bulky furniture and repeated loading | Lower floor height and easier ramp access | Check exact body size and rear access |
| Tail-lift Luton | Heavy appliances, commercial goods and pallets | Mechanical assistance with heavy loading | Tail lift capacity and maintenance must suit the work |
| Curtainsider | Larger commercial loads and side access | Loading flexibility from the side | Less suitable where weather protection is essential during loading |
A low loader is particularly useful where teams repeatedly move bulky but manageable items. Because the chassis and floor sit lower, loading through a rear ramp can be easier and less physically demanding. It may reduce the need for a tail lift on certain jobs, although it does not remove the need for proper manual-handling procedures.
A tail lift becomes more important when the business regularly moves heavy appliances, palletised goods or commercial equipment. View it as a working tool, not an optional extra. Check its lift capacity, how it operates in the spaces the business visits and whether staff are trained to use it safely.
The loading process should protect the team.
In removals and delivery work, time pressure can encourage poor handling habits. That is where the right vehicle setup makes a real difference.
A well-planned Luton should allow the team to move goods from trolley to vehicle with minimal unnecessary lifting. A rear ramp, low load floor or tail lift can all help, depending on the cargo. Inside the body, secure the load with appropriate rails, straps, blankets, and protective materials.
Position the heaviest items carefully and restrain them properly. Filling the space tightly is not enough. Weight distribution affects handling, braking and stability, especially when a high box body is fully loaded.
Drivers should also allow for the different driving characteristics of a Luton van. Height affects low bridges, car parks and overhanging trees. A larger body can be more vulnerable to crosswinds. Reversing cameras, parking sensors and a clear route plan are practical safeguards, not unnecessary upgrades.
Why roof height and wheelbase deserve more attention
A Luton van’s body dimensions are not standard across every manufacturer or model. Buyers should confirm the exact roof height, internal dimensions and wheelbase for the vehicle they are considering.
The tallest available body may sound like the obvious choice, but it can limit access. A company that regularly enters multi-storey car parks, town-centre delivery points or residential streets with low branches needs to know its vehicle height precisely.
Wheelbase affects more than internal capacity. A longer vehicle may offer useful loading space but can be harder to position in tight streets or outside customer homes. For a removals business working primarily in suburban locations, the ability to park close to the property can sometimes matter more than a small increase in body length.
The right setup fits the routes and the cargo.
Buying around availability and support
Vehicle availability matters in a sector where a van off the road can quickly affect bookings and customer service. A business should ask whether the required model is in stock, how quickly it can be delivered and what support is available if it needs servicing or repairs.
Current Swiss Vans Luton stock covers a range of manufacturers and configurations, including standard bodies, low loaders and selected tail-lift options. That variety is useful because the body style should match how the company loads and unloads, rather than being chosen only by make preference.
Finance should be considered in the same practical way. Buying outright may suit a company that intends to keep a vehicle for many years. Leasing or hire purchase can help spread the cost, but the agreement needs to reflect realistic mileage and the likely replacement cycle.
A removals company with seasonal peaks should be especially careful not to choose a vehicle finance arrangement that becomes difficult during quieter months.
The van should make every job more repeatable.
The strongest Luton setup creates a repeatable loading routine. Staff know where blankets, straps and trolleys are stored. Drivers know the vehicle height and route limitations. The business knows the tail lift, ramp, and rear doors suit its normal load.
That repeatability drives the return. It reduces damage, shortens loading times and gives customers more confidence that their goods are being handled professionally.
A Luton van is not simply a larger delivery vehicle. It can become the operational centre of a removals or logistics business. Choose the body, access equipment, and dimensions around the work being done, and it will make difficult loads feel far more manageable from the first collection to the final drop.

From Sketch to Sign-Off: A Step-by-Step UX Prototyping Framework Used by Leading US Design Agencies

How do you choose the right metal for an engagement ring: platinum, gold or rose gold?

The Growing Interest in Peptides for Health and Wellness

Who Is Shameera? All You Need To Know About Charli XCX’s Mother

Who Is Gulliver Flynn Oldman? The Untold Story of Sir Gary Oldman’s Son

Meet Rosemary Turner: The Mother of Actor Callum Turner
-
Biographies8 months ago
Who Is Shameera? All You Need To Know About Charli XCX’s Mother
-
Biographies7 months ago
Who Is Gulliver Flynn Oldman? The Untold Story of Sir Gary Oldman’s Son
-
Biographies8 months ago
Meet Rosemary Turner: The Mother of Actor Callum Turner
-

 Biographies6 months ago
Who is Alexandra James? Inside The Life of Jeremy Clarkson’s Former Partner
-
 Biographies8 months ago
Who is Todd McRae? Meet Tate McRae’s Father
-
 Biographies7 months ago
Who Is Daniel Mara? The Untold Story of Kate Mara’s Private Sibling
-
 Celebrity8 months ago
Who Is Peter Hernandez? The Real Story of Bruno Mars’ Father
-
 Biographies8 months ago
Who Is Alvin Martin? All About the Whoopi Goldberg’s First Husband